Waste Generated and Recycled: Tracking and Measurement
The University of Johannesburg (UJ) has implemented a comprehensive waste tracking system to monitor and manage the waste generated and recycled across its campuses. This initiative reflects UJ's commitment to environmental sustainability and responsible resource management.
Waste Tracking and Measurement
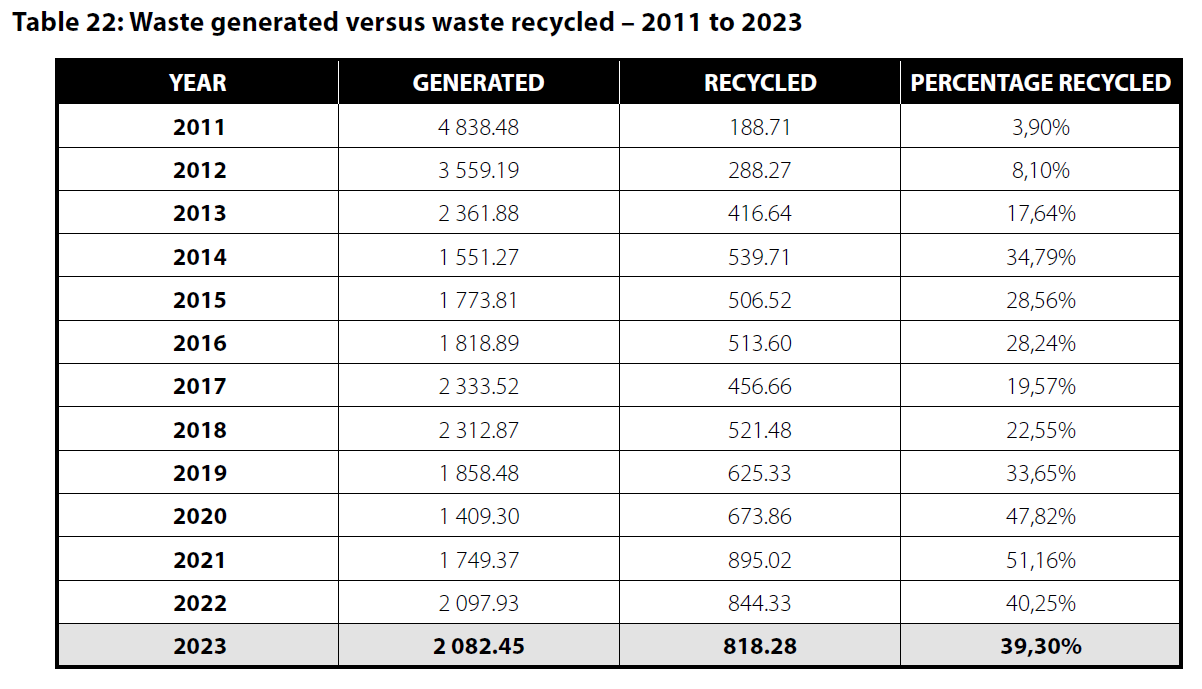
UJ systematically records and analyses various categories of waste, including paper, plastic, cans, electronic waste, fluorescent tubes, cardboard, glass, scrap metal, wet waste, and garden refuse. This detailed tracking enables the university to assess the effectiveness of its waste management strategies and identify areas for improvement. For instance, in 2023, UJ generated approximately 2,082.45 tonnes of waste, of which 818.28 tonnes were recycled, achieving a recycling rate of 39.30%. This data is meticulously compiled and presented in the university's annual reports, providing transparency and accountability in its sustainability efforts.
Policy Framework Supporting Waste Tracking
The university's commitment to waste tracking is reinforced by its Energy, Resource, Waste, and Sustainability (ERWSus) Policy for 2022–2025. This policy emphasizes the development of effective waste management techniques and the implementation of monitoring strategies and models. By establishing a robust framework, UJ ensures that waste tracking is an integral component of its operational practices, facilitating continuous improvement in waste reduction and recycling efforts.
Campus Food Waste Management
In addition to general waste tracking, UJ places a specific focus on managing campus food waste. Recognizing the environmental impact of food waste, the university records, tracks, and measures this category as 'wet waste.' This targeted approach allows UJ to implement strategies aimed at reducing food waste, promoting sustainable consumption, and enhancing food security within the campus community.
Continuous Improvement and Sustainability Goals
UJ's waste tracking system is not merely a record-keeping exercise but serves as a critical tool for informing policy decisions and sustainability initiatives. By analyzing waste generation and recycling data, the university can set realistic targets, allocate resources effectively, and engage the campus community in waste reduction campaigns. This proactive approach underscores UJ's dedication to fostering an environmentally conscious culture and achieving its long-term sustainability objectives.
Through its comprehensive waste tracking and measurement practices, the University of Johannesburg exemplifies a robust commitment to environmental stewardship, ensuring that waste management remains a central pillar of its operational ethos.
UJ Annual Reports: Waste Management
UJ Annual Report 2023 – Waste Management – Waste Tracking and Measurement
UJ Annual Report 2022 – Waste Management – Waste Tracking and Measurement
UJ Facilities Management Annual Reports
UJ Facilities Management Annual Report 2023
UJ Annual Report 2023 – Facilities Management
UJ Facilities Management Annual Report 2022
UJ Annual Report 2022 – Facilities Management
UJ Waste Generated and Recycled Data 2023
Table 1: Different types of waste recycled from January 2011 to December 2023
| YEAR | COM PAPER | WHITE PAPER | PLASTIC | CANS | E WASTE F TUBES |
CARD- BOARD BOXES |
GLASS | SCRAP METAL | WET WASTE | GAR- DEN REFUSE |
TOTAL | % |
|---|---|---|---|---|---|---|---|---|---|---|---|---|
| 2011 | 22.452T | 26.934T | 26.689T | 13.742T | 0.14T | 37.427T | 28.74T | 29.803T | 0 | 0 | 188.71T | 3.90 |
| 2012 | 42.385T | 41.505T | 18.797T | 9.45T | 1.7T | 56.417T | 30.38T | 11.108T | 7.671T | 0 | 288.27T | 8.10 |
| 2013 | 39.46T | 40.142T | 18.028T | 10.005T | 1.21T | 37.805T | 18.793T | 7.364T | 14.2T | 136.5T | 416.63T | 17.64 |
| 2014 | 40.088T | 36.855T | 19.615T | 9.964T | 1.44T | 48.274T | 13.93T | 6.768T | 36.22T | 325.5T | 538.70T | 34.75 |
| 2015 | 31.579T | 51.725T | 20.335T | 7.117T | 0.17T | 63.932T | 31.521T | 4.071T | 15.16T | 329.14T | 506.51T | 28.55 |
| 2016 | 53.681T | 21.877T | 34.056T | 6.347T | 0.11T | 52.574T | 16.218T | 17.048T | 18.68T | 293T | 513.60T | 28.89 |
| 2017 | 40.667T | 17.526T | 42.149T | 8.189T | 6.08T | 59.824T | 27.062T | 0.552T | 4.61T | 250.98T | 456.66T | 19.56 |
| 2018 | 37.016T | 45.997T | 44.592T | 5.5515T | 1.91T | 40.346T | 5.102T | 1.34T | 8.82T | 263.14T | 521.48T | 22.54 |
| 2019 | 32.614T | 43.121T | 25.062T | 5.908T | 3.385T | 41.16T | 47.057T | 4.051T | 15.23T | 407T | 625.33T | 33.65 |
| 2020 | 21.63T | 17.98T | 12.68T | 2.58T | 2.72T | 31.58T | 19.77T | 10.26T | 30.66T | 524T | 673.86T | 47.81 |
| 2021 | 13.952T | 17.34T | 6.31T | 1.408T | 3.112T | 23.877T | 22.317T | 14.194T | 12.506T | 780T | 895.02T | 51.16 |
| 2022 | 32.158T | 16.746T | 13.811T | 2.728T | 2.862T | 29.423T | 19.771T | 5.03T | 2.629T | 719.2T | 844.33T | 40.25 |
| 2023 | 24.31T | 25.14T | 24.99T | 5.53T | 2.60T | 35.13T | 19.06T | 5.86T | 12.64T | 663.1T | 818.30T | 39.30 |
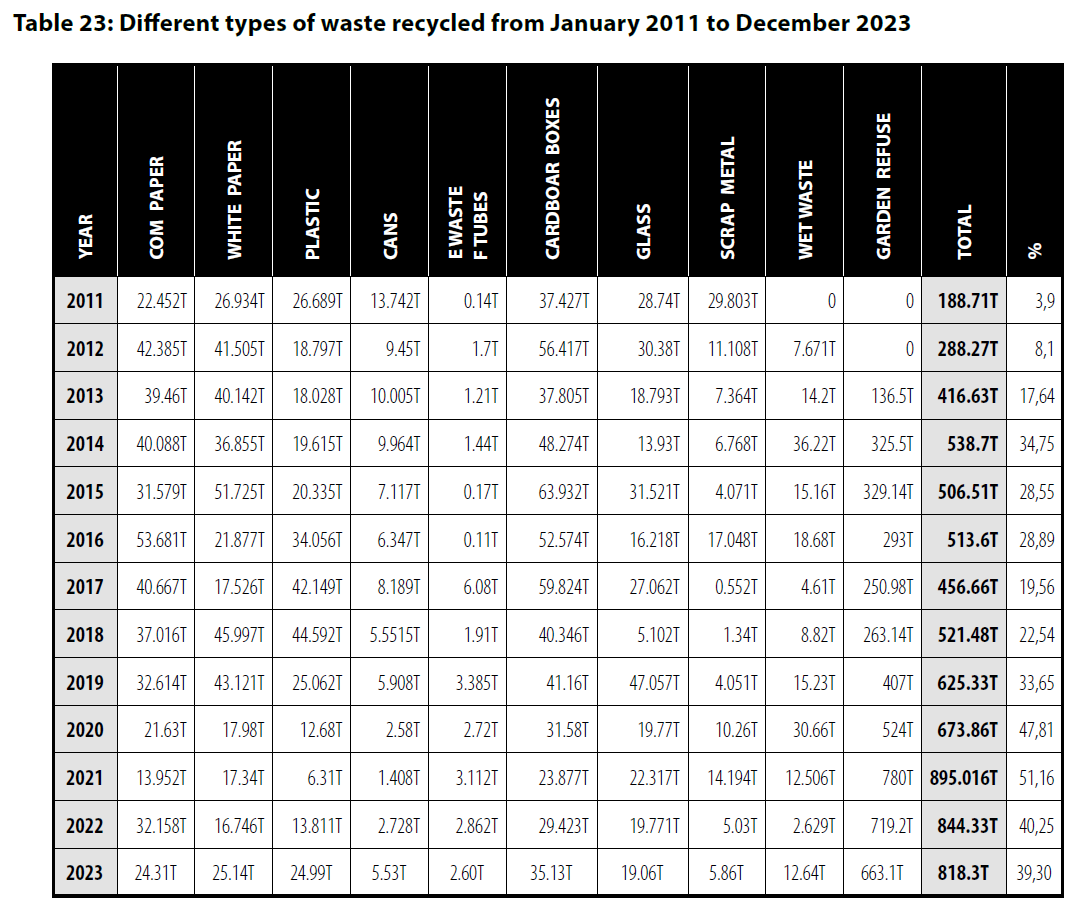
Table 2: Waste generated versus waste recycled – 2011 to 2023
| YEAR | GENERATED | RECYCLED | PERCENTAGE RECYCLED |
|---|---|---|---|
| 2011 | 4 838.48 | 188.71 | 3.90% |
| 2012 | 3 559.19 | 288.27 | 8.10% |
| 2013 | 2 361.88 | 416.64 | 17.64% |
| 2014 | 1 551.27 | 539.71 | 34.79% |
| 2015 | 1 773.81 | 506.52 | 28.56% |
| 2016 | 1 818.89 | 513.6 | 28.24% |
| 2017 | 2 333.52 | 456.66 | 19.57% |
| 2018 | 2 312.87 | 521.48 | 22.55% |
| 2019 | 1 858.48 | 625.33 | 33.65% |
| 2020 | 1 409.30 | 673.86 | 47.82% |
| 2021 | 1 749.37 | 895.02 | 51.16% |
| 2022 | 2 097.93 | 844.33 | 40.25% |
| 2023 | 2 082.45 | 818.28 | 39.30% |